Consider a dataset of \(n\) points, \((x_1, y_1), (x_2, y_2), \ldots, (x_n, y_n)\), where
the means of \(x_1, x_2, \ldots, x_n\) and \(y_1, y_2, \ldots, y_n\) are 15 and 5, respectively
the variances of \(x_1, x_2, \ldots, x_n\) and \(y_1, y_2, \ldots, y_n\) are \(\sigma_x^2\) and \(\sigma_y^2\), respectively
the correlation coefficient between \(x_1, x_2, \ldots, x_n\) and \(y_1, y_2, \ldots, y_n\) is \(r\)
We define a new set of values, \(z_1, z_2, \ldots, z_n\), as follows:
$$ z_i = 3x_i - y_i, \quad i = 1, 2, \ldots, n $$
a)
4 pts Suppose we fit a simple linear regression line to the dataset \((x_1, z_1), (x_2, z_2), \ldots, (x_n, z_n)\) by minimizing mean squared error. Note that \(z\) is the variable being predicted, not \(y\). Let \(h(x_i)\) represent the corresponding line.
What is the value of \(h(15)\)? Your answer should be a number with no variables.
\(h(15) =\) ______
Solution
\(h(15) = 40\).
The key fact being assessed here is that the line that minimizes mean squared error always passes through
$$ (\text{mean of input variable}, \text{mean of output variable}) $$
Normally this is stated as the line passing through the point \((\bar{x}, \bar{y})\), but here the output variable is \(z\), not \(y\).
The mean of \(z\) is \(3 \bar{x} - \bar{y}\), as we explored in a homework problem, and this is
$$ 3 \bar{x} - \bar{y} = 3(15) - 5 = 40 $$
b)
8 pts\(\sigma_z^2\), the variance of \(z_1, z_2, \ldots, z_n\), can be written in the form \(\sigma_z^2 = 9 \sigma_x^2 + \sigma_y^2 + C\).
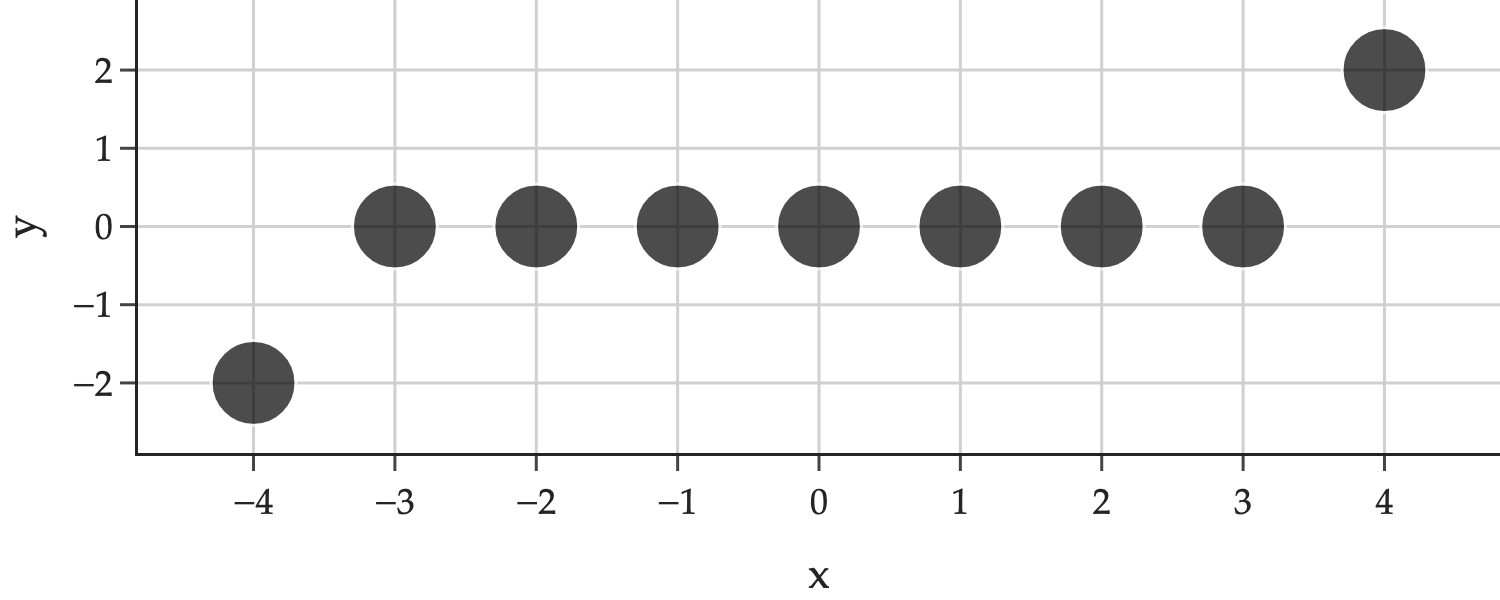
Let \(k\) be a positive integer and let \(\alpha\) be a positive real number. Consider the dataset of \(n = 2k+1\) points, \(\underbrace{(-k, -\alpha), (-k+1, 0), (-k+2, 0), \ldots, (-1, 0)}_{k \text{ points}}, (0, 0), \underbrace{(1, 0), \ldots, (k-2, 0), (k-1, 0), (k, \alpha)}_{k \text{ points}}\).
Note that the \(x\)-values are equally spaced, starting from \(-k\) and ending at \(k\). The \(y\)-values are all 0, except for the first and last points, which have \(y\)-value \(-\alpha\) and \(\alpha\), respectively. For example, if \(k = 4\) and \(\alpha = 2\), the dataset looks like
a)
4 pts Find \(\bar{x}\) and \(\bar{y}\), the means of the \(x\)- and \(y\)-values, respectively. Give your answers as expressions involving \(k\), \(\alpha\), and/or other constants.
Both sets of values average to 0: \(\bar{x} = 0\) and \(\bar{y} = 0\).
The \(x\)-values are evenly spaced and centered around 0. If you were to add them up, the \(-k\) would cancel out with the \(k\), the \(k-1\) would cancel out with the \(-k+1\), and so on, making the sum 0, and hence the average 0.
The \(y\)-values are all 0, except for the first and last points, which have \(y\)-value \(-\alpha\) and \(\alpha\), respectively. The average of the \(y\)-values is therefore \(\frac{-\alpha + \alpha}{2k+1} = 0\).
b)
6 pts Suppose we fit a simple linear regression model to the dataset by minimizing mean squared error. \(w_1^{\ast}\), the slope of the regression line, is of the form
There are several equivalent formulas for the slope of the regression line, \(w_1^{\ast}\), and any of them would allow us to answer the question quickly. Let’s start with
But, we know that for all data points other than \(i=1\) (the point \((-k, -\alpha)\)) and \(i=n\) (the point \((k, \alpha)\)), \(x_i = 0\). Therefore,
Finally, let \(\sigma_x\) and \(\sigma_y\) be the standard deviations of the \(x\)-values and \(y\)-values in the dataset, respectively. Assume that \(\sigma_x > 0\) and \(\sigma_y > 0\).
a)
5 pts Which of the following is the relationship between \(M\) and \(\sigma_y^2\)? Select an answer and provide a brief explanation in the box provided.
\(M \leq \sigma_y^2\)\(M = \sigma_y^2\)\(M \geq \sigma_y^2\) Impossible to tell
Solution
\(M \leq \sigma_y^2\)\(M = \sigma_y^2\)\(M \geq \sigma_y^2\) Impossible to tell
\(M\) is the mean squared error of the best simple linear regression model for the dataset; it minimizes the mean squared error among all models of the form
$$ h(x_i) = w_0 + w_1 x_i $$
The constant model, \(h(x_i) = w\), can be thought of as a more restrictive version of the simple linear regression model, in that it has an intercept \(w\) and slope of \(0\). So, the best simple linear regression model is at least as good as the best constant model, when both are measured by mean squared error. If the \(x\) and \(y\) values in the dataset have no linear association, meaning the correlation coefficient \(r\) is 0, then the best simple linear regression model is the same as the best constant model; otherwise, the best simple linear regression model is better, since it has all of the flexibility of the constant model, and more. The first section of Chapter 2.5 discusses this idea further.
b)
5 pts Suppose that \(M = 0\). What is the value of \(r\), the correlation coefficient between the \(x\)-values and \(y\)-values in the dataset? \(\boxed{\text{Circle}}\) your final answer and provide a brief explanation. If there are multiple possible values, state them all.
Solution
\(r = 1\) or \(r = -1\).
The only case in which \(M = 0\) is when the best simple linear regression model makes 0 errors, i.e. it passes through every point in the dataset. This happens when the \(x\) and \(y\) values in the dataset have a perfect linear association, meaning \(r = 1\) (positive linear association) or \(r = -1\) (negative linear association).
c)
2 pts True or False: It is possible for there to be multiple pairs of \((\text{intercept}, \text{slope})\) with a mean squared error of \(M\).
True False
Solution
True False
The values of \(w_0^{\ast}\) and \(w_1^{\ast}\) are unique. We’ve seen several formulas for them in the notes; they are the unique minimizers of
2 pts True or False: It is possible for there to be multiple pairs of \((\text{intercept}, \text{slope})\) with a mean squared error of \(M + 1\).
True False
Solution
True False
The values of \(w_0\) and \(w_1\) that minimize \(R_\text{sq}(w_0, w_1)\) are unique, but we’re not discussing the minimizers here, so that fact is irrelevant.
Instead, it’s asking whether it’s possible for there to be multiple pairs of \((w_0, w_1)\) with a mean squared error of something bigger than \(M\). The \(+1\) is not important; we could have stated \(+17\) or \(+3\pi^2\) and the question would be the same.
Recall from Chapter 2.3 that the graph of \(R_\text{sq}(w_0, w_1)\) looks like a bowl in \(\mathbb{R}^3\). While there’s only one point at which the bowl is minimized, for any height (\(z\)-value) greater than \(M\), there are infinitely many pairs of \((w_0, w_1)\) that give that height. To see this, imagine slicing the bowl with the plane \(z = M + 1\). This slice is an ellipse (stretched circle), upon which infinitely many combinations of \((w_0, w_1)\) lie.
So, yes, it is possible for there to be multiple pairs of \((w_0, w_1)\) with a mean squared error of \(M + 1\) — in fact, that’s guaranteed.
Suppose a dataset of \(n\) points, \((x_1, y_1), (x_2, y_2), \ldots, (x_n, y_n)\), has the following properties:
$$ \text{mean of }y\text{-values} = \bar y = 11, \qquad \text{standard deviation of }x\text{-values} = \sigma_x = 2, \qquad \sigma_y = 6 $$
The simple linear regression line that minimizes mean squared error for predicting \(y_i\) from \(x_i\) is
$$ h(x_i) = 15 - x_i $$
a)
3 pts What is \(\bar x\), the mean of the \(x\)-values? Give your answer as a number with no variables.
\(\bar x = \_\_\_\_\_\_\)
Solution
The regression line must pass through \((\bar x, \bar y)\), so
$$ 11 = 15 - \bar x $$
This gives
$$ \bar x = \boxed{4} $$
Now, consider a new dataset, \((t_1, z_1), (t_2, z_2), \ldots, (t_n, z_n)\), defined by \(t_i = 5 - x_i\) and \(z_i = 2y_i - 1\).
Let \(g(t_i) = \beta_0^{\ast} + \beta_1^{\ast} t_i\) be the best simple linear regression line for predicting \(z_i\) from \(t_i\).
b)
6 pts Find \(\beta_0^{\ast}\), the intercept of the best simple linear regression line for predicting \(z_i\) from \(t_i\). Show your work, and write your final answer in the box provided. Your answer should be a number with no variables.
$$ \beta_0^* = \_\_\_\_\_\_ $$
Solution
First, use the original regression line to find the original correlation, which we’ll call \(r_{xy}\). The slope is \(-1\), so
Now, what is \(r_{tz}\)? Replacing \(x_i\) with \(t_i=5-x_i\) flips the sign of the correlation, while replacing \(y_i\) with \(z_i=2y_i-1\) keeps the sign the same. So the correlation between \(t_i\) and \(z_i\) is
$$ r_{tz} = \frac{1}{3} $$
Also,
$$ \bar t = 5-\bar x = 5 - 4 = 1, \qquad \bar z = 2\bar y - 1 = 2 \cdot 11 - 1 = 21 $$
Where did these facts come from? In general, if \(x_1, x_2, …, x_n\) have a mean of \(\bar x\) and a standard deviation of \(\sigma_x\), then \(a x_1 + b, a x_2 + b, …, a x_n + b\) have a mean of \(a \bar x + b\) and a standard deviation of \(|a| \sigma_x\). This was discussed in an early homework problem.
4 pts Let \(M\) be the mean squared error of the model \(h(x_i) = 15 - x_i\)’s predictions on the dataset \((x_1, y_1), (x_2, y_2), \ldots, (x_n, y_n)\), and \(M’\) be the mean squared error of the model \(g(t_i) = \beta_0^{\ast} + \beta_1^{\ast} t_i\)’s predictions on the dataset \((t_1, z_1), (t_2, z_2), \ldots, (t_n, z_n)\).
What is the value of the fraction \(\frac{M}{M’}\)? If it’s not clear, \(M’\) is on the denominator.
\(1/5\)\(1/4\)\(1/2\)\(1\)\(2\)\(4\)\(5\) Impossible to tell
Solution
\(1/5\)\(1/4\)\(1/2\)\(1\)\(2\)\(4\)\(5\) Impossible to tell
The intuitive answer is that since we’ve stretched out the \(y\)-values by a factor of \(2\), the mean squared error is multiplied by a factor of \(4\), so the fraction \(\frac{M}{M’}\) is \(\frac{1}{4}\).
Let’s show this a bit more formally. First, note that
Suppose we fit a simple linear regression model with an intercept term, \(h(x_i)=w_0+w_1x_i\), to a dataset of \(n\) points \((x_1, y_1), (x_2, y_2), \ldots, (x_n, y_n)\) by minimizing mean squared error. You are given the following information:
The fit model satisfies \(h(-4) = 5\) and \(h(8) = 14\).
The mean of \(y_1, y_2, \ldots, y_n\) is \(\bar y = 2\).
a)
6 pts Find \(\bar x\), the mean of \(x_1, x_2, \ldots, x_n\). Show your work, and write your final answer in the box provided. Your answer should be a number with no variables. Hint: What property does the line \(h(x_i)\) satisfy?
$$ \bar x = \_\_\_\_\_\_ $$
Solution
The line through \((-4,5)\) and \((8,14)\) has slope
so \(w_0^{\ast}=8\), and the fit model is \(h(x_i) = 8 + \frac{3}{4}x_i\).
For simple linear regression with an intercept, the fit line passes through \((\bar x,\bar y)\). Since \(\bar y=2\),
$$ 2=8+\frac34\bar x \implies \bar x = -8 $$
which gives \(\boxed{\bar x=-8}\).
b)
4 pts Suppose the correlation coefficient between the \(x\)-values and \(y\)-values is \(r = 1/3\).
The standard deviation of \(y\), \(\sigma_y\), is \(c\) times the standard deviation of \(x\), \(\sigma_x\). In other words,
$$ \sigma_y = c \sigma_x $$
What is the value of \(c\)?
\(1/4\)\(4/9\)\(3/4\)\(9/4\)\(3\)\(4\)
Solution
\(1/4\)\(4/9\)\(3/4\)\(9/4\)\(3\)\(4\)
For simple linear regression, one (of the many equivalent) formula for the slope \(w_1^{\ast}\) is
$$ w_1^*=r\frac{\sigma_y}{\sigma_x} $$
From part a), \(w_1^{\ast}=\frac34\). Since \(r=\frac13\) and \(\sigma_y=c\sigma_x\),
$$ \frac34=\frac13c $$
so \(\boxed{c=\frac94}\).
c)
4 pts Let \(e_i=y_i-h(x_i)\) be the fit model’s error for the \(i\)th point. Note that \(e_i\) may either be positive or negative. Which of the following statements are guaranteed to be true? Select all that apply.
Solving these equations gave us \(w_0^{\ast}\) and \(w_1^{\ast}\). But if we take a closer look, these equations are telling us properties about the errors, \(e_i = y_i - h(x_i) = y_i - (w_0 + w_1 x_i)\). Above, I’ll substitute in \(e_i\) every time I see a \(y_i - (w_0 + w_1 x_i)\).
So, hidden in plain sight were these properties about the errors! Recall, the four options in this question are:
\(\displaystyle\sum_{i=1}^n e_i=0\)
\(\displaystyle\sum_{i=1}^n x_i e_i=0\)
\(\displaystyle\sum_{i=1}^n y_i e_i=0\)
\(\displaystyle\sum_{i=1}^n e_i(x_i-\bar x)=0\)
So, we know the first two are true.
What about the third option, \(\displaystyle\sum_{i=1}^n y_i e_i=0\)? The short answer is that there’s no reason to believe this is true; if it were, it would have emerged from our analysis above. To be sure that it’s not true, let’s find a counterexample.
which is only \(0\) when the fit line has zero error on every point, i.e. passes through every single point.
Above, you may be wondering why it’s the case that
$$ \sum_{i = 1}^n h(x_i) e_i = 0 $$
Intentionally, I haven’t provided the proof of this! I want you to piece the proof together. Start by using the fact that the first two options in this question are true.
Suppose we fit a simple linear regression model to a dataset of \(n\) points, \((x_1,y_1),(x_2,y_2),\ldots,(x_n,y_n)\), by minimizing mean squared error. Let \(\bar x\) and \(\bar y\) be the means of the \(x\)-values and \(y\)-values, respectively, and suppose the standard deviations \(\sigma_x\) and \(\sigma_y\) are both positive. Let
$$ h(x_i)=w_0^*+w_1^*x_i $$
be the best simple linear regression line for the original dataset.
Now, we create a new dataset of \(n+1\) points by starting with the original dataset and adding one new point,
$$ (x_{n+1},y_{n+1})=(\bar x,c) $$
where \(c\) is a constant. Let
$$ h_{\text{new}}(x_i)=w_0'+w_1'x_i $$
be the best simple linear regression line for the new dataset.
a)
6 pts Prove that \(w_1’ = w_1^{\ast}\), i.e. that the new slope is the same as the old slope, no matter what \(c\) is. Hint: Start with any of the formulas for the optimal slope that involve summations in the numerator and denominator, and separate the sums.
Solution
The optimal slope for simple linear regression can be written as
as derived in Chapter 2.3. There are several other equivalent formulas, e.g. with \(\sum_{i=1}^n (x_i-\bar{x})(y_i-\bar{y})\) on the numerator, but this one keeps the algebra simplest, as it doesn’t require us to think about the new value of \(\bar y\).
For the new dataset, the mean of the \(x\)-values is still \(\bar{x}\), since